The Excel Spreadsheet
So you, have unfortunately, agreed to try to analyze data in which a well-meaning person has encoded a variable as highlighter colors.
Yellow rows = control arm
Red rows = test arm
Is there an alternative to manually typing in a new variable, study_arm, with values “control” and “test”?
Fortunately, the {tidyxl} package can help, by getting under the hood and into the structure of this excel (xlsx) spreadsheet.
Getting started
Let’s start with a simple titanic example, included in the {tidyxl} package. First load the tidyxl and readxl packages, and read in the excel file from the package.
# read in file from package
titanic <- system.file("extdata/titanic.xlsx", package = "tidyxl")
readxl::read_excel(titanic)
# A tibble: 10 × 7
   ...1  ...2   Age      Child ...5  Adult ...7
   <chr> <chr>  <chr>    <chr> <chr> <chr> <chr>
 1 <NA>  <NA>   Survived No    Yes   No    Yes
 2 Class Sex    <NA>     <NA>  <NA>  <NA>  <NA>
 3 1st   Male   <NA>     0     5     118   57
 4 <NA>  Female <NA>     0     1     4     140
 5 2nd   Male   <NA>     0     11    154   14
 6 <NA>  Female <NA>     0     13    13    80
 7 3rd   Male   <NA>     35    13    387   75
 8 <NA>  Female <NA>     17    14    89    76
 9 Crew  Male   <NA>     0     0     670   192
10 <NA>  Female <NA>     0     0     3     20
Extracting Cell Data
We would like to identify and extract the cells highlighted in yellow. In this case, these are the cells in row 10 (row 11 in Excel, counting the header row), for the variables Adult and …7. But this is not obvious from the tibble.

So we will have to dig deeper into the xlsx file with the help of {tidyxl}. Let’s use the xlsx_cells() function to get more information on each cell, and store this in the object, x.
x <- xlsx_cells(titanic)
x
# A tibble: 60 × 21
   sheet  address   row   col is_blank data_type error logical numeric
   <chr>  <chr>   <int> <int> <lgl>    <chr>     <chr> <lgl>     <dbl>
 1 Sheet1 C1          1     3 FALSE    character <NA>  NA           NA
 2 Sheet1 D1          1     4 FALSE    character <NA>  NA           NA
 3 Sheet1 E1          1     5 TRUE     blank     <NA>  NA           NA
 4 Sheet1 F1          1     6 FALSE    character <NA>  NA           NA
 5 Sheet1 G1          1     7 TRUE     blank     <NA>  NA           NA
 6 Sheet1 C2          2     3 FALSE    character <NA>  NA           NA
 7 Sheet1 D2          2     4 FALSE    character <NA>  NA           NA
 8 Sheet1 E2          2     5 FALSE    character <NA>  NA           NA
 9 Sheet1 F2          2     6 FALSE    character <NA>  NA           NA
10 Sheet1 G2          2     7 FALSE    character <NA>  NA           NA
# … with 50 more rows, and 12 more variables: date <dttm>,
#   character <chr>, character_formatted <list>, formula <chr>,
#   is_array <lgl>, formula_ref <chr>, formula_group <int>,
#   comment <chr>, height <dbl>, width <dbl>, style_format <chr>,
#   local_format_id <int>
Now we have information on each cell (identified by address) in each sheet, with row and column information, details on data_type, formulas, comments, style_format, and the underlying data in separate columns by data type. This helps us find (and filter) for specific cells or rows.
Extracting Formatting Data
But we also need to get at the formatting. This can be done with xls_formats() from {tidyxl}. Warning: the output will be very long and icky. Be prepared to scroll down a lot.
formats <- xlsx_formats(titanic)
formats
This gives you the formats object, which is of the list class. This is a highly nested data structure. You can explore formats by clicking on it in the Environment Tab, then a tab for formats will open up in the Source Pane. Click on the blue arrow to the left of formats in the Source Pane - then dig deeper into the nesting by clicking on the blue arrow in turn for
local, then
fill
patternFill
fgColor (foreground color)
rgb (the only one with content)
We are looking for the fill (highlighting) for the two cells highlighted in yellow.
This can be found programmatically with
formats$local$fill$patternFill$fgColor$rgb
[1] NA NA NA "FFFFFF00"which is honestly, quite hideous, but is just following the layers of nesting above that you clicked through in the Source Pane.
But a nested list is an efficient way to store information when there are a lot of empty cells. Most of the cells will not be highlighted, so the folks who wrote Excel used this approach. The output identifies one RGB highlighting color used as a fill in this spreadsheet, “FFFFFF00”, which is yellow.
Isolating the Highlighted Cells
The hard part is knowing where to hunt for the formatting you want to find. Digging around in the nested structure in the Source pane can help (especially if you have suggestions from the {tidyxl} web page). Once we have this color information, we can filter our x object to just the yellow-highlighted cells, with
x %>%
  filter(local_format_id %in%
      which(formats$local$fill$patternFill$fgColor$rgb == "FFFFFF00")) %>%
  select(address, data_type) ->
location
location
# A tibble: 2 × 2
  address data_type
  <chr>   <chr>
1 F11     numeric
2 G11     numeric
This takes the x object, then filters it on the local_format_id variable for a local format in which the fill color is yellow (which in this case turns out to be local_format_id = 4). Then we select the address column to get the cells that have been highlighted in the spreadsheet (F11 and G11 in this case).
Finding the Highlighted Values
To get the highlighted values out, as these cells both contain numeric data, we can do the following:
x %>%
  filter(address %in% location$address) %>%
  select(address, numeric)
# A tibble: 2 × 2
  address numeric
  <chr>     <dbl>
1 F11           3
2 G11          20
So the highlighted values are 3 and 20.
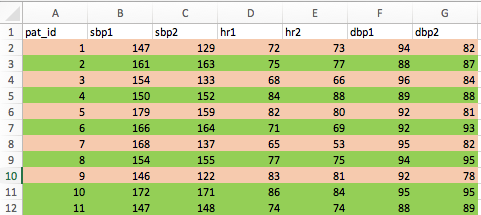
A Pilot Trial
Imagine a pilot trial of blood pressure medication with the study arm encoded as a highlighting color by row. Here is a picture of the original spreadsheet.
Let’s read in the excel file.
pilot_path <- here("_posts/2021-01-13-extracting-highlighting-as-data-from-excel/bp_pilot.xlsx")
pilot <- read_xlsx(pilot_path)
pilot
# A tibble: 11 × 7
   pat_id  sbp1  sbp2   hr1   hr2  dbp1  dbp2
    <dbl> <dbl> <dbl> <dbl> <dbl> <dbl> <dbl>
 1      1   147   129    72    73    94    82
 2      2   161   163    75    77    88    87
 3      3   154   133    68    66    96    84
 4      4   150   152    84    88    89    88
 5      5   179   159    82    80    92    81
 6      6   166   164    71    69    92    93
 7      7   168   137    65    53    95    82
 8      8   154   155    77    75    94    95
 9      9   146   122    83    81    92    78
10     10   172   171    86    84    95    95
11     11   147   148    74    74    88    89
From this tibble, we can’t see which rows were coded as test (red) vs. control (green). Let’s follow the same approach - first we will extract cell data.
Extracting Cell Data
pilot_cells <- xlsx_cells(pilot_path)
pilot_cells
# A tibble: 84 × 21
   sheet  address   row   col is_blank data_type error logical numeric
   <chr>  <chr>   <int> <int> <lgl>    <chr>     <chr> <lgl>     <dbl>
 1 Sheet1 A1          1     1 FALSE    character <NA>  NA           NA
 2 Sheet1 B1          1     2 FALSE    character <NA>  NA           NA
 3 Sheet1 C1          1     3 FALSE    character <NA>  NA           NA
 4 Sheet1 D1          1     4 FALSE    character <NA>  NA           NA
 5 Sheet1 E1          1     5 FALSE    character <NA>  NA           NA
 6 Sheet1 F1          1     6 FALSE    character <NA>  NA           NA
 7 Sheet1 G1          1     7 FALSE    character <NA>  NA           NA
 8 Sheet1 A2          2     1 FALSE    numeric   <NA>  NA            1
 9 Sheet1 B2          2     2 FALSE    numeric   <NA>  NA          147
10 Sheet1 C2          2     3 FALSE    numeric   <NA>  NA          129
# … with 74 more rows, and 12 more variables: date <dttm>,
#   character <chr>, character_formatted <list>, formula <chr>,
#   is_array <lgl>, formula_ref <chr>, formula_group <int>,
#   comment <chr>, height <dbl>, width <dbl>, style_format <chr>,
#   local_format_id <int>
There are four different local_format_id values (1 through 4). But which is green, and which is red highlighting?
Let’s dig into the formats.
Extracting Formatting Data
pilot_formats <- xlsx_formats(pilot_path)
pilot_formats
Now open the pilot_formats object by clicking on it in the Environment Tab. In the source pane, explore the nested list by clicking on blue arrows for
local
fill
patternFill
fgColor
rgb
and you will see 3 options in rgb - NA, and 2 RGB colors.
Now let’s pull these with
pilot_formats$local$fill$patternFill$fgColor$rgb
[1] NA "FFED7D31" "FF92D050"Ignore the first FF, and the rest of the 2 strings represent a code for an RGB color. Go to https://www.colorhexa.com and type in the codes (prefix these with a hashtag) for #ED7D31 and then #92D050.
These two RGB colors are orangish-red and green, respectively.
So if the color “FFED7D31” is present in the cell formatting, that row is a trial participant in the test arm, and if the color “FF92D050”, that row is a trial participant in the control arm.
Now we can mutate to create a new variable, study_arm and fill it with “test” and “control”.
pilot_cells %>%
  filter(local_format_id %in%
  which(pilot_formats$local$fill$patternFill$fgColor$rgb == "FFED7D31")) %>%
  select(address, row, data_type) %>%
  filter(str_detect(address,"A")) %>%
  mutate(tibblerow = row - 1) %>%
  pull(tibblerow) ->
test_rows
test_rows
[1] 1 3 5 7 9Now we can use the test_rows vector to mutate the correct rows to “test” for a new variable, study_arm
pilot %>%
  rownames_to_column(var = "rowname") %>%
  mutate(study_arm =
    case_when(rowname %in% test_rows ~ "test",
              TRUE ~ "control")) %>%
  select(rowname, sbp1:sbp2, dbp1:dbp2, study_arm)
# A tibble: 11 × 6
   rowname  sbp1  sbp2  dbp1  dbp2 study_arm
   <chr>   <dbl> <dbl> <dbl> <dbl> <chr>
 1 1         147   129    94    82 test
 2 2         161   163    88    87 control
 3 3         154   133    96    84 test
 4 4         150   152    89    88 control
 5 5         179   159    92    81 test
 6 6         166   164    92    93 control
 7 7         168   137    95    82 test
 8 8         154   155    94    95 control
 9 9         146   122    92    78 test
10 10        172   171    95    95 control
11 11        147   148    88    89 control
which does, in fact, match up with the original spreadsheet.
So if you are ever facing a spreadsheet where data is encoded as colors, hopefully this walk-through will help.
–
You can get more information about {tidyxl} and where to find formatting like bold, etc. here. The official pkgdown website and reference manual for {tidyxl} can be found here. You can unpack lots of badly assembled spreadsheets with the {tidyxl} and {unpivotr} packages. This is well beyond the scope of this post, but there are lots of worked examples, an online cookbook, and even screencasts.
This blog was created with the {distill} package. Distill is a publication format for scientific and technical writing, native to the web.
Learn more about using Distill at https://rstudio.github.io/distill.