knitr::include_graphics(
  here("_posts/2023-08-26-multipanel-figure-with-legend/multipanel_with_legend.png"))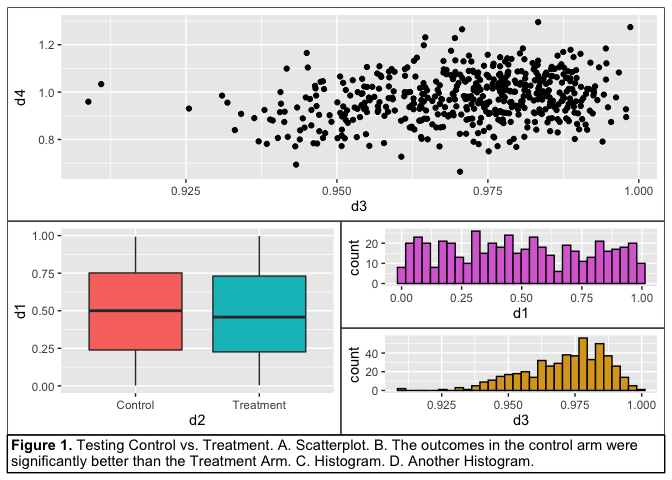
The Multipanel Figure with a Single Legend
It is quite common for medical journals (which strictly limit the number of figures) to publish multipanel figures with a single legend for all panels of the figure at the bottom, in its own bounding box.
Note that this blog post is the result of several discussions at
https://community.rstudio.com/t/plot-in-a-box-with-long-text-legend-in-a-box/51962
and
Let’s walk through how to create this.
Data
First, let’s generate data for four dummy figures for the purposes of the layout.
Plots
Now we will generate the four dummy plots, p1 through p4.
p1 <- ggplot(data=plotData) + geom_point(aes(x=d3, y=d4)) +
  theme(plot.background = element_rect(color='black'))
p2 <- ggplot(data=plotData) + geom_boxplot(aes(x=d2,y=d1,fill=d2))+
  theme(legend.position="none") +
  theme(plot.background = element_rect(color='black'))
p3 <- ggplot(data=plotData) +
  geom_histogram(aes(x=d1, color=I("black"),fill=I("orchid"))) +
  theme(plot.background = element_rect(color='black'))
p4 <- ggplot(data=plotData) +
  geom_histogram(aes(x=d3, color=I("black"),fill=I("goldenrod"))) +
  theme(plot.background = element_rect(color='black'))
Legend Text
Now we will generate the legend text. There are some key pieces here that will turn out to be important later.
- Setting the padding around the text in the element_textbox with the {ggtext} package. The plot_annotation function in {ggtext} allows some fine tuning.
- Tweaking the margins on left and right, which are inherited (+5/+5) from the plot above. Note that margins and padding are expressed in TROUBLE (T,R,B,L) order.
fig_legend <- plot_annotation(
  caption = "**Figure 1.**  Testing Control vs. Treatment.   A. Scatterplot.
  B. The outcomes in the Control Arm were slightly better than
  the Treatment Arm. C. A Histogram. D. Yet Another Histogram.",
  theme = theme(
    plot.caption = element_textbox_simple(
      size = 11,
      box.colour = "black",
      linetype = 1,
      linewidth = 0.3,
      padding = unit(c(3, 3, 3, 3), "pt"),
      margin = unit(c(0, -5, 0, -5), "pt"), #note negative left and right margins because inherits margins from plots
      r = unit(0, "pt")
    )
  )
)
Multipanel Plot
Now, to put this all together with {patchwork}. I will add tags for general coolness.
p1 + {
  p2 + {
    p3 +
      p4 +
      plot_layout(ncol=1)
  }
} + fig_legend +
  plot_layout(ncol=1) +
  plot_annotation(tag_levels = 'A') &
  theme(plot.tag = element_text(size = 11, face = 'bold'))